Sun Cycles Gallery at Sun-Cycles.com

VIEW GALLERY
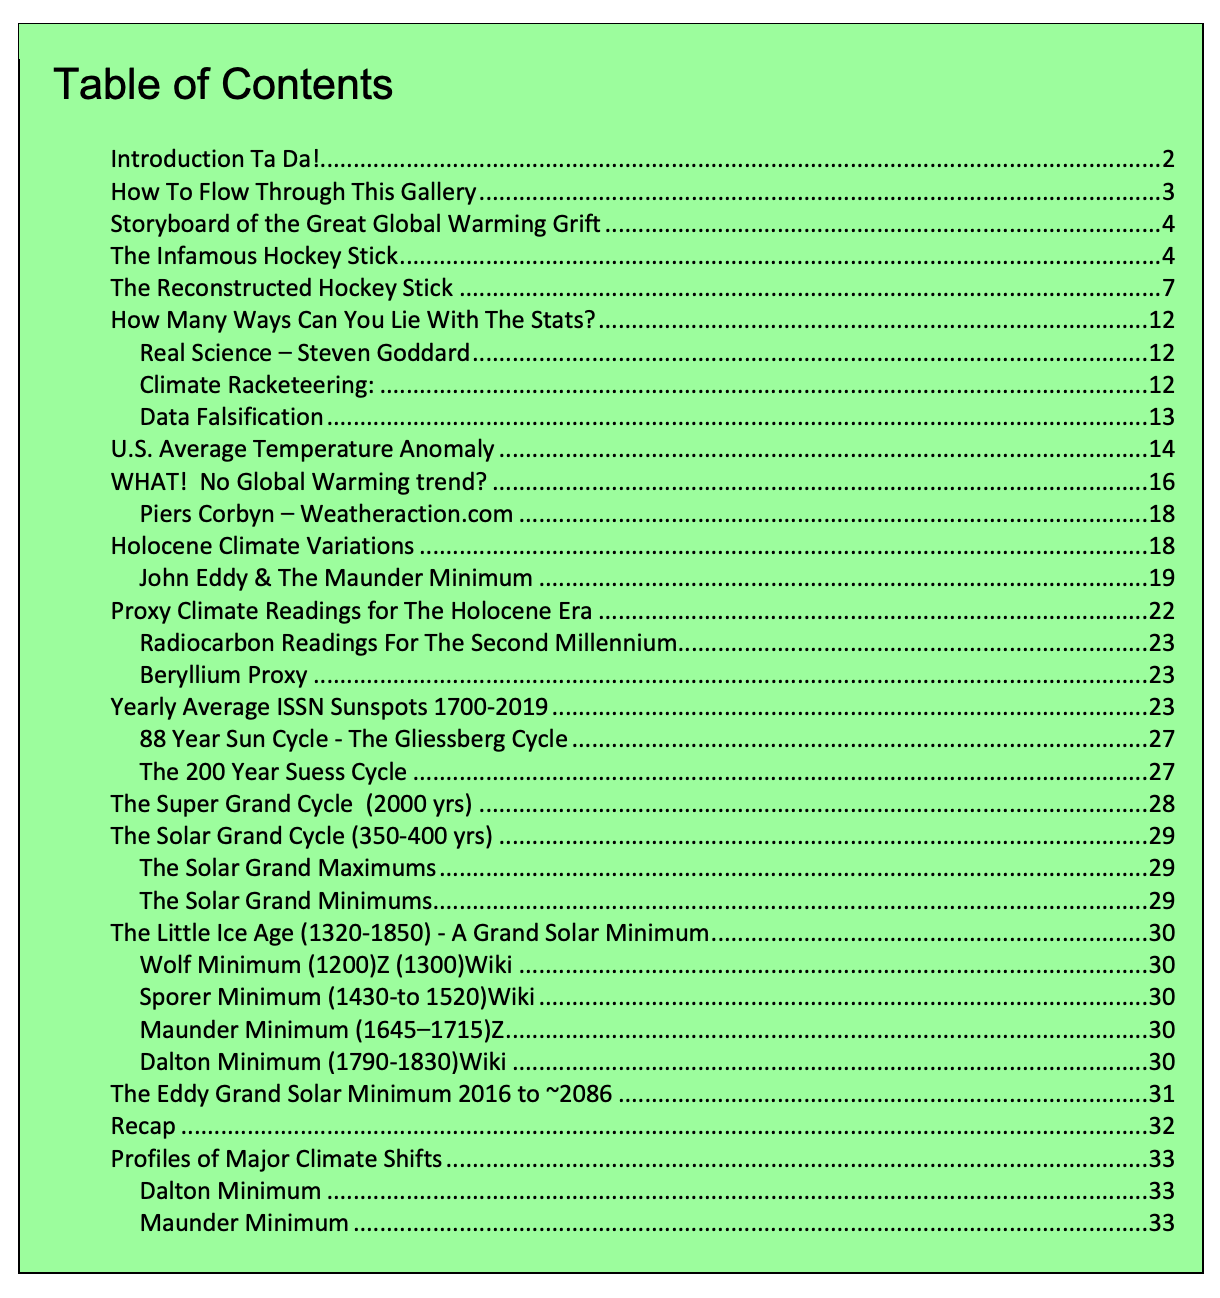
Click on Table of Contents
Click image to View extensive Gallery of charts
The Sun Cycles Gallery is a storyboard which uses the most important graphs and trends of solar activity and climate changes from the beginning of the climate change debate in the 1990s to now. The most important findings of many scientists are assembled to slay all ignorance. Short vignettes for each graph explain the graphs, their significance, and how each one led to the next. Many graphs demonstrate why the entire debate has upended Climate Alarmism and begun a new appreciation of the Sun's role in creating Earth's climate.
View Extensive GALLERY
of Charts
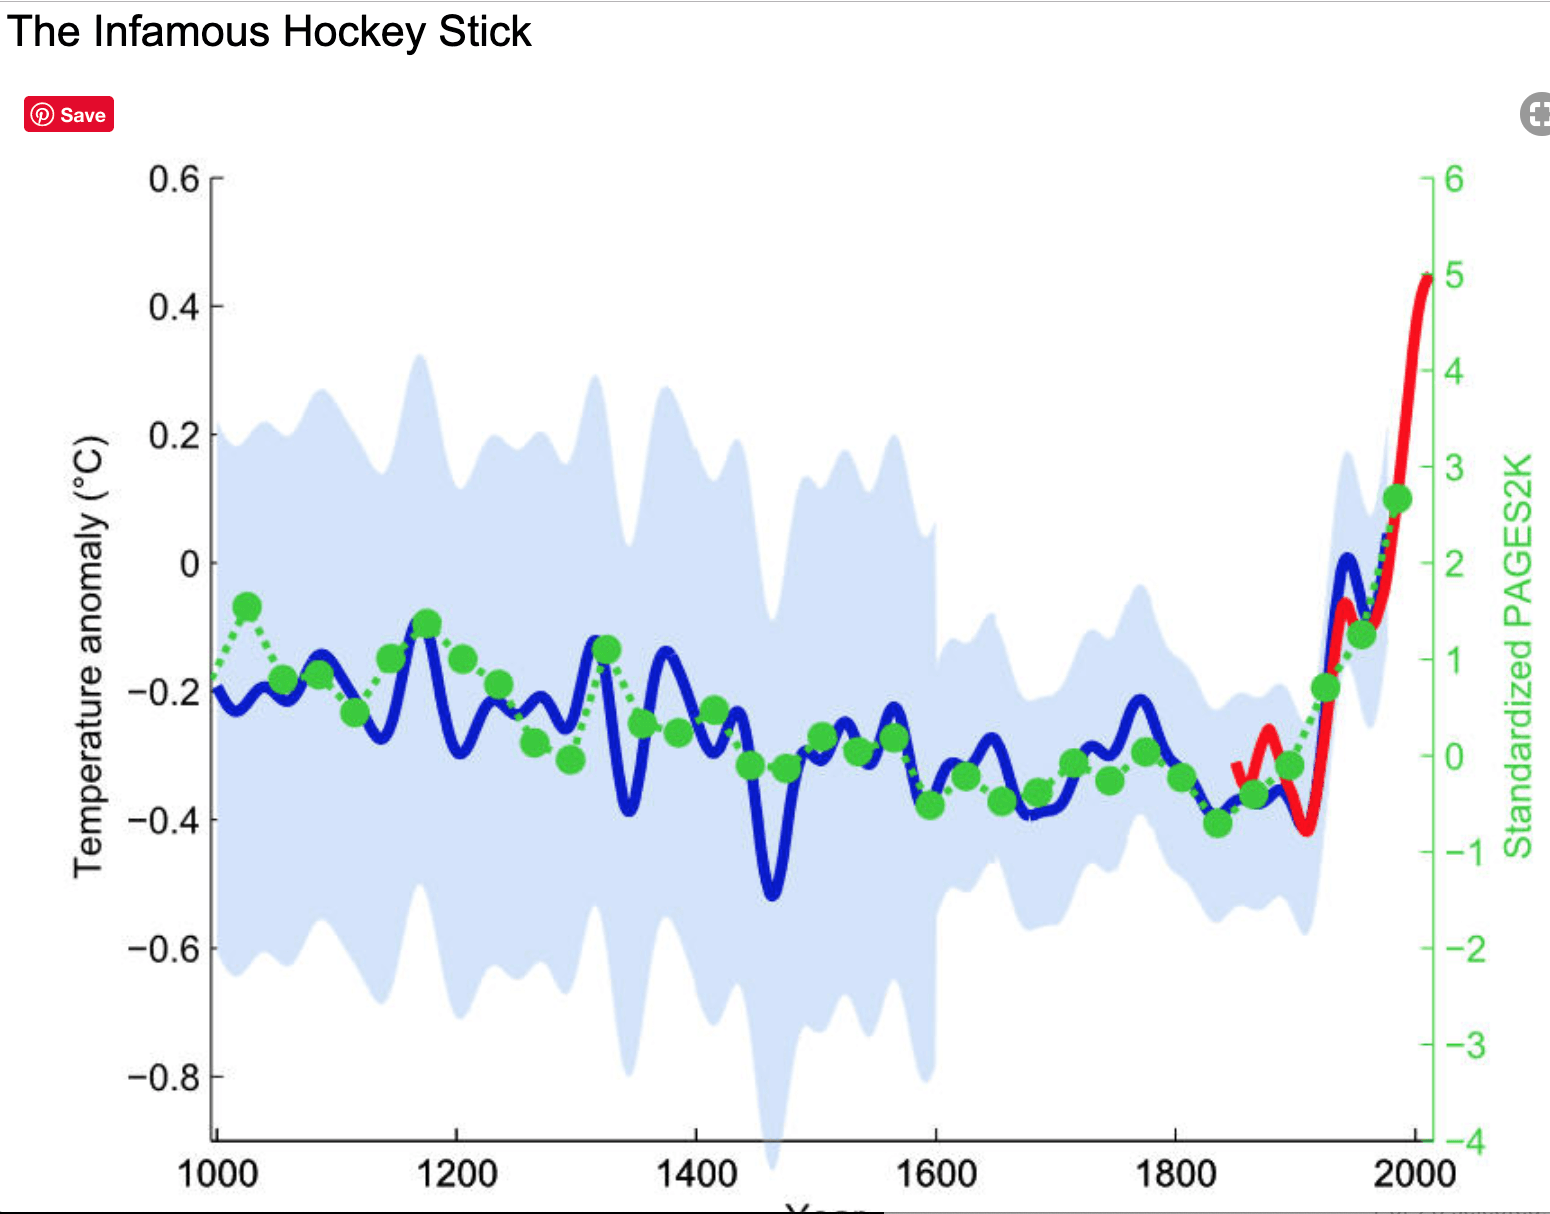
The controversial graph made famous by Michael Mann et. al. in 1999. Click chart to view more.
The original northern hemisphere hockey stick graph of Mann, Bradley & Hughes 1999, smoothed curve shown in blue with its uncertainty range in light blue, overlaid with green dots showing the 30-year global average of the PAGES 2k Consortium 2013 reconstruction. The red curve shows measured global mean temperature, according to HadCRUT4 data from 1850 to 2013.